Search
Recent comments
- naked.....
7 hours 38 min ago - darkness....
8 hours 1 min ago - 2019 clean up before the storm....
13 hours 21 min ago - to death....
14 hours 24 sec ago - noise....
14 hours 7 min ago - loser....
16 hours 47 min ago - relatively....
17 hours 9 min ago - eternally....
17 hours 15 min ago - success....
1 day 3 hours ago - seriously....
1 day 6 hours ago
Democracy Links
Member's Off-site Blogs
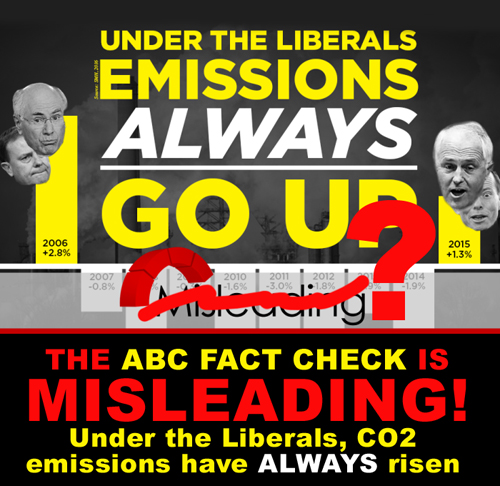
bullshit from the ABC fact checker...

The most recent national inventory report on greenhouse gases looked at the trends driving changes in emissions since 1990.
It noted that population and GDP growth in particular have driven emissions up, counterbalanced by more efficient use of energy, structural changes in the economy and a movement away from less emissions intense energy sources like coal.
Roger Dargaville, deputy director of the Melbourne Energy Institute told Fact Check the major driver in the decline in emissions from 2007 to 2012 was falling demand for electricity, primarily driven by rising electricity prices.
"It's nice for the Labor government that the numbers more or less work out for them but increasing electricity prices was mainly because of the distribution and transmissions companies being awarded billions of dollars to fit out the network," he said.
-----------------------
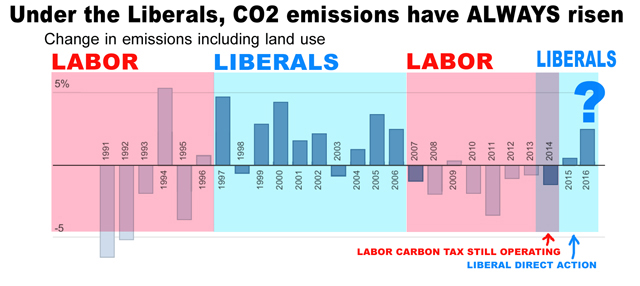
The FACT CHECKER FORGETS TO LOOK AT HIS/HER OWN CHART:

Though it is not a good indication of CO2 reductions due to the vagaries of accounting, the Labor years prior to John Howard show SUBSTANTIAL emission reductions between 1990 and 1996 on average 2.75 per cent including a bad year.
John Howard was in power from 1996 onwards and on average the CO2 emission under his government was more than 2.5 per cent per annum till 2007.
Labor came in power from 2007 to 2013. emission reductions averaged minus 1. 25 per cent. This was due to rising prices of electricity due to the CARBON PRICING. The price of electricity due to replacing poles and wires was minimal in this reduction.
2014, the year in which Tony Abbott was PM was still under the regime of Labor's CARBON PRICING and has to be accounted as a Labor year, till the repeal of the carbon pricing with the help of double-dealing Clive Palmer.
2015, after the carbon pricing (carbon tax) was removed and the awful Direct Action was introduced the emissions rose and now the rise is about 3.5 per cent per annum on last count.
ON AVERAGE, UNDER THE LIBERALS, EMISSION TRENDS OF CO2 ALWAYS GO UP, WHILE UNDER LABOR THEY GO DOWN.
The ABC should sack the person in charge of doing the "fact checks". Bias? For sure.
- By Gus Leonisky at 8 Jun 2016 - 4:50pm
- Gus Leonisky's blog
- Login or register to post comments
the chart trend...